很多时候在处理log文件的时候,我们希望能够绘制数值随时间变化曲线。
gnuplot是一个命令行作图工具,具有很强大的交互式作图能力。而结合管道功能也可以很方便地满足我的需求。
我的log文件如下:
Epoch LR Train Loss Val Loss Train Acc Val Acc
1.000000 0.000250 0.006155 0.006397 0.210200 0.371615
2.000000 0.000250 0.004988 0.062103 0.405610 0.490865
3.000000 0.000250 0.004645 0.011359 0.513939 0.563074
4.000000 0.000250 0.004415 0.004224 0.573226 0.632654
5.000000 0.000250 0.004252 0.004261 0.611022 0.667559
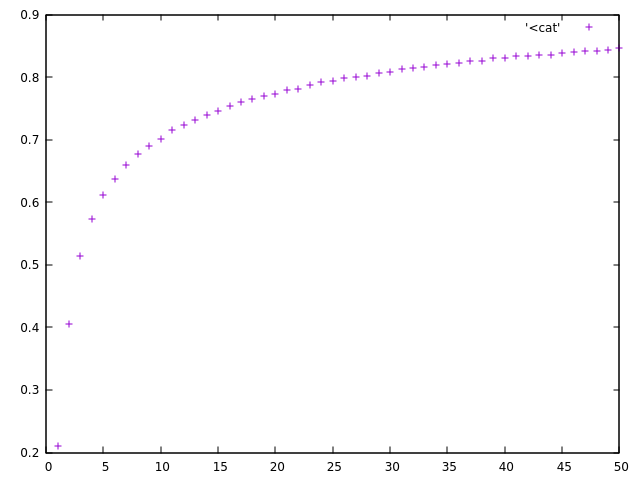
首先进行一些文本处理:去除第一行标题,然后选择第1列作为横坐标,第6列作为纵坐标,最后将数据送进gnuplot里作图即可。
命令行如下:cat ./log.txt | sed '1d' | awk '{print $1"\t"$6}' | gnuplot -p -e "plot '<cat'"
sed指令的作用是删除第一行,awk指令提取指定列,gnuplot命令中-p用来使图像暂停,不会在程序运行完成后直接消失。
效果如图:
如果是在远程服务器上,可以在gnuplot中设置set terminal dumb,图像会输出在终端窗口中。
命令:cat ./log.txt | sed '1d' | awk '{print $1"\t"$6}' | gnuplot -p -e "set terminal dumb;plot '/dev/stdin'"